The term Mississippian is US term used to describe the early Carboniferous period. The term Carboniferous is used in England to identify the period spanning 359.2 to 299 million years ago when the earth was rich with deposits of coal. These deposits were found at that time all over Northern Europe, Asia, and Midwestern and Eastern North America.
The Mississippian Subsystem is differentiated from the Pennsylvanian by the appearance of the conodont Declinognathodus noduliferus, the ammonoid genus Homoceras, and the foraminifers Millerella pressa and Millerella marblensis, though these markers apply only to marine deposits. The distinction between the Mississippian and Pennsylvanian subsystems may also be illustrated by a break in the flora due to transitional changes from a marine to a more terrestrial environment.
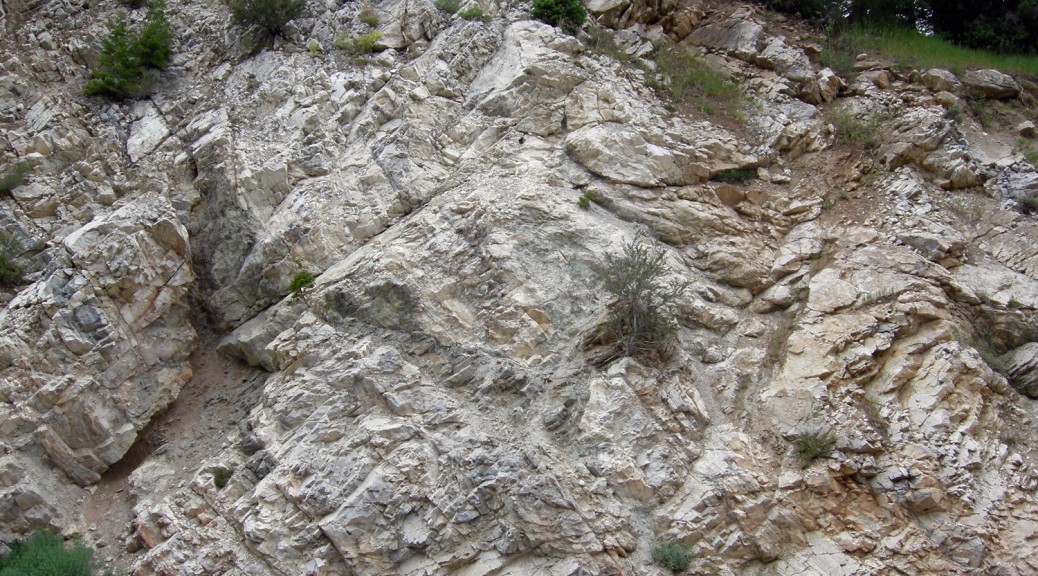
The stratigraphy of the Mississippian is distinguished by shallow-water limestones. Some of these limestones are composed of parts of organisms, primarily the remains of crinoids that thrived in the shallow seas. Other limestones include lime mudstones, composed of the carbonate mud produced by green algae, and oolithic limestones, composed of calcium carbonate in concentric spheres produced by high wave energy. Also found in Mississippian strata, though not as common, are sandstones (sedimentary rock composed of quartz sand and cemented by silica or calcium carbonate) and siltstones (rock composed of hardened silt).
At left, scientists in a coal mine have color coded the successive layers of coal ball formation. Each layer represents an individual flood event in the coal swamp. On the right, a scientist observes the evidence of glacial and interglacial strata in Kansas. Glacial periods result in lowered ocean levels, while interglacial periods result in a rise in ocean levels, covering the continental shelf with shallow seas.
Coal beds, which can be up to 11 to 12 meters thick, characterize the late Carboniferous. The forests of seedless vascular plants that existed in the tropical swamp forests of Europe and North America provided the organic material that became coal. Dead plants did not completely decay and were turned to peat in these swamp forests. When the sea covered the swamps, marine sediments covered the peat. Eventually, heat and pressure transformed these organic remains into coal. Coal balls, pockets of plant debris that were preserved as fossils and not converted to coal, are sometimes found within the coal layers.
Multiple transgressions and regressions of the Pennsylvanian seas across the continent can be seen in the rocks, and even counted, because they leave a telltale sequence of layers. As sea levels rise, the layers may go from sandstone (beach), to silty shale or siltstone (tidal), to freshwater limestone (lagoon), to underclay (terrestrial), to coal (terrestrial swampy forest). Then as sea levels fall, one may see a shale (nearshore tidal) grade to limestone (shallow marine) and finally to black shale (deep marine).
Index fossils are the remains of plants and animals that characterize a well-defined time span and occur over a wide range of geography. Fossils of marine life characterize the Mississippian, as shallow epicontinental seas covered the United States at that time. These fossils include solitary corals and Syringopora, tubular colonial corals. Other fossil colonial corals include Stelechophyllum and Siphonodendron. Because conodont fossils are distributed all over the world, they are utilized internationally to date Mississippian rocks.
According to the University of California Museum of Paleontology, “The Mississippian environment of North America was heavily marine, with seas covering parts of the continent. As a result, most Mississippian rocks are limestone, which are composed of the remains of crinoids, lime-encrusted green algae, or calcium carbonate shaped by waves.”
“The stratigraphy of the Mississippian is distinguished by shallow-water limestones. Some of these limestones are composed of parts of organisms, primarily the remains of crinoids that thrived in the shallow seas. Other limestones include lime mudstones, composed of the carbonate mud produced by green algae, and oolithic limestones, composed of calcium carbonate in concentric spheres produced by high wave energy. Also found in Mississippian strata, though not as common, are sandstones (sedimentary rock composed of quartz sand and cemented by silica or calcium carbonate) and siltstones (rock composed of hardened silt).”